Data Visualization
The Quicklinks Dialog
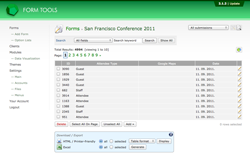
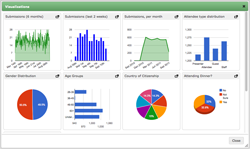
As mentioned on the previous page, the quicklinks dialog is the primary way to view your visualizations. After your form contains one or more visualizations, you'll see a new icon appear in the quicklinks bar at the top right of the Submission Listing page. See the screenshot to the right: see the pie chart icon? That's the one! When you click it, a dialog window will appear that automatically loads all the visualizations.
There's actually a great deal of functionality stashed away in the dialog, so lets dissect it bit by bit.
- Navigation
- Admin Buttons (easy management!)
- Refreshing the Cache
- Dialog Size and Thumb Sizes
- Other Stuff
Navigation
If you only have a single visualization, when the dialog window opens it will automatically render the visualization as full size: you won't see any unnecessary navigation. But otherwise, the dialog will automatically tile all the visualizations.
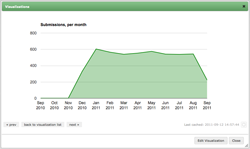
To see any of the tiled visualizations in full screen, click the icon at the top right of the tile. As soon as you do that, you'll see some navigation appear at the bottom left: « prev, back to visualization list, and next ». Clicking each takes you to the appropriate page.
This is a nice simple way to get around. As mentioned elsewhere, feel free to re-size the dialog if you want to see the visualization in a larger format.
Admin Buttons (easy management!)
Depending on who is viewing the dialog (admin or client) and where (Submission Listing page or on the Manage Visualizations page), the buttons will will change. For the administrator on the Submission Listing page, they'll see a "Manage Visualizations" button which, when clicked, redirects them to the module visualization list page - and it automatically tailors the list for visualizations in that particular form.
This is a terrific way to quickly manage that subset of your visualizations.
When the adminstrator selects a particular visualization in the quicklinks dialog so they are viewing it full screen, the button changes to "Edit Visualization". As you'd expect, when you click that, it takes you to the appropriate Edit Visualization page in the module where you can tweak the values. Again, this cuts down the time to locate and tweak each visualization.
Refreshing the Cache
Caching is really important in order to display the visualizations reasonably quickly, however, it can lead to confusing results if you forget the data's been cached! So, when viewing a visualization full screen in the quicklinks dialog, at the bottom right of the dialog window it lists the last cache time. For administrators (and clients, if they have been permitted to do so on the Main Settings page), a small "Refresh" icon will appear to the right of it. Form Tools users can just click that icon to request the cache be re-updated on the fly.
Dialog size and thumb sizes
You may change the default sizes to whatever you want. Just go to the Module's "Main Settings" page. There, change the "Quicklinks dialog default dimensions" and "Visualization thumb size" values. For more information on that, see the Main Settings page.
Other Stuff
- Charts look different whether they are small or large. If there's too much information to display in a tiny thumbnail, Google Charts will do it's best to only show the pertinent info. Be warned!
- Even though the data is cached for each visualization, the quicklinks dialog still may take a little time to load: if you have dozens of visualizations which are loading large data sets, this can take time! Also, Google Charts does a great deal of work when actually rendering the charts.


