Data Visualization
Creating a Field Chart
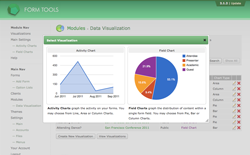
To create a new Field Chart, select the module from the Modules page in the Form Tools administrator interface and click the "Create New Visualization" button at the bottom of the page. That will open up a dialog window that looks something like the screenshot to the right. Mouseover the second column - Field Charts - and click.
The Add Field Chart page looks something like the second screenshot on this page. As with the other configuration pages, the page shows two visualizations - thumbnail and full size - which get updated as you fill in the page. Here's what each of the fields mean.
Main Settings
| Visualization Name | The unique name of this visualization, used to describe what it's about. |
| Form | The form that contains the field you're interested in visualizing. |
| View | The form View. After you select this option, the fields dropdown will be populated with all the fields in the selected View. |
| Field | The field you're interested in visualizing. As mentioned elsewhere, Field Charts generally work best on fields that are assigned to Option Lists - i.e. dropdowns, radios and checkboxes. |
Appearance
This section is where you can customize the look and feel of the visualization.
| Chart Type | The type of chart. Try selecting different ones to see how they look. |
| Ignore fields with empty values | This setting is important to produce quality charts. If the form fields you're visualizing isn't required, the likelihood is that it contains any number of empty values. Graphing empty values can throw off the chart, so this setting lets you rectify it. |
| Colour | This is for Bar and Column charts only. It determines the colour of the bars / columns. |
Pie Chart Settings
| Pie Chart Format | Whether you want a 2D or 3D pie chart. |
| Include legend in thumbnail | This setting controls whether the small thumbnail version of the visualization which appears in the Quicklinks Dialog should contain a legend or not. Generally, you probably won't want to include it, because there isn't enough space. However, if you've increased the size of the thumbnail on the Main Settings page, you may wish to include the legend. |
| Include legend in full size | This determines whether or no the full size thumbnail contains the legend or not. The full size visualization is what you see in the Quicklinks Dialog after clicking on a particular visualization. It also controls the presence of the legend in visualizations loaded through the Pages module and in pages loaded in your own pages. |

